Does The RGB Data Really Support a Rent Freeze?

In February, Mayor Zohran Mamdani appointed six members to the nine-person Rent Guidelines Board (RGB), handing his administration a majority on the body that sets rent increases for nearly one million stabilized apartments in New York City. The vote this summer, effective October 1, 2026 through September 30, 2027, will be closely watched as it comes seven years after 2019’s Housing Stability and Tenant Protection Act (HSPTA) and property owners feel the bite of high interest rates together with the inability to raise rents commensurate with dollars invested into renovations. The vote will either offer owners the status quo, which is hard, or a promise of an even bumpier road ahead with a rent freeze. But does the data support that?
Mamdani campaigned on a four-year rent freeze and has not walked that back. His board appointments signal intent. What an investor needs to understand today is not just whether a freeze happens, but what the financial data actually shows about stabilized building health, where the real stress lines are, and how this vote should affect how you price, hold, or dispose of rent-regulated assets going into the back half of 2026.
On March 26, the RGB released its annual Income and Expense Study, based on data from nearly 17,800 buildings covering more than 805,000 apartments during 2024. The headline number figures notably showed a 6.2% increase in net operating incomes for all buildings with at least one stabilized unit. This quickly became a political flashpoint. Tenant advocates cited it as justification for a freeze. Landlord groups argued the figured obscured the real, on-the-ground narratives that were playing out. Both are partially right.
Market Context
The RGB process follows a set schedule each year. This spring, the board will collect data, hear expert testimony, and publish research. In late spring, it sets a preliminary range for rent adjustments. Public hearings follow across the five boroughs. The final vote is typically held in late June, with any change taking effect for leases renewing or vacancies beginning on or after October 1. That means the window between now and the vote is short, roughly 90 days, and the data the board is working from is already public.
The broader economic backdrop is important. The Federal Reserve is holding the federal funds rate at 3.5% to 3.75% percent, with only one cut projected for 2026 as of this writing. Inflation, while lower than its 2022 peak, remains elevated enough that operating costs for building owners continue to rise. The RGB study found operating costs up 4.2% in 2024, with property taxes accounting for more than a quarter of all expenses – coming in at an average of $316 in tax expenses per unit, out of an estimated cost of $1,203 per unit, per month. Insurance, fuel, and maintenance costs all continued their multi-year climb.
At the same time, the city’s fiscal position is under real pressure. The Comptroller projects a $2.2 billion budget gap in FY 2026, growing to $10.4 billion in FY 2027, driven in part by tariff-related economic drag and federal funding uncertainty. Property tax revenue, according to former NYC Comptroller Brad Lander “remain [ed] the single largest revenue source at $34.8B” in NYC’s Fiscal Year 2025. If real estate values deteriorate, the gap in the budget widens. That’s structurally baked into the system. That dynamic gives the Adams holdover appointees on the board, and pragmatic members of Mamdani’s slate, reason to think carefully before an outright freeze.
Digging into the Data
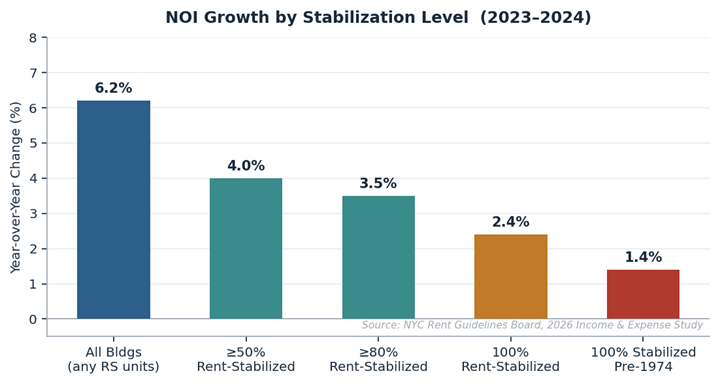
The 6.2% growth in NOI is real, but it makes for a misleading headline. The study’s own data shows the number varies widely, depending on the segmentation of rent stabilization concentrations, and the date of construction for properties. As implied in the chart below, year over year NOI growth is inversely correlated with how rent stabilized the buildings are (by %). All else equal, the more fair market units the buildings have, the less distressed they are going to be.
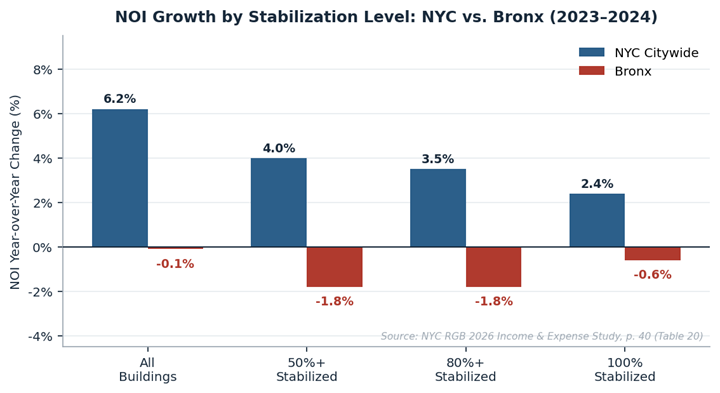
The 2026 RGB Income and Expense Study’s Table 20 (found on page 40) confirms this trendline by highlighting the negative NOI growth for Bronx Properties, which historically have the greatest concentration of rent stabilized units in NYC. As shown on the graphic below. NOI growth is 6.3% less than the average building in the other boroughs. If the RGB freezes rents on these units, what happens to their upkeep?
What makes the Bronx picture more concerning is that the 2025 Income and Expense Study, reporting 2022-2023 data, already showed the warning signs. Bronx pre-1974 buildings that were 100% stabilized posted NOI of -0.1% in that report, essentially flat but technically negative. One year later, the same cohort sits at -2.3%. The 80%+ stabilized pre-1974 cohort moved from +0.2% to -2.8%. The 50%+ stabilized cohort moved from +0.3% to -2.8%. This is not a single-year data spike. It is a deteriorating trend that was already visible in the prior report, accelerating in the current one.
