How is NYC faring post-Covid?
NYC's economic recovery told through charts
Inflation in the month of June slowed down to 3% year-over-year, its lowest pace in over two years, but a closer look reveals some interesting insights. Housing was responsible for 70% of the 3% increase in the CPI for the month of May. As a category, housing was also the second leading contribution to the CPI number. It increased 7.8% versus the prior year. Ahead of housing was transportation services. Car insurance increased rose to 17% year over year and vehicle maintenance was at 12.7%. Cost of airfare declined by 19% and that helped stabilize costs of transport at an 8.2% year over year increase overall. The third largest category of increases was restaurant foods, which increased 7.7%.
What do the fastest growing CPI categories tell us about the state of things?
Multifamily properties bought during the pandemic should still benefit from continued rent growth, at least for now.
Eating out at restaurants continues to get more expensive.
Flying to Italy this year is comparatively cheaper (and more fun?) than a road trip in the U.S.
How about in NY?
One way to look at the post covid recovery in NYC is to look at the MTA subway ridership. The data tells an interesting story. Neighborhoods traditionally used for office work have fewer subway riders than the average of NYC. This is the case for Midtown Manhattan and the Financial District, which hover at 71% and 72% of 2019 ridership levels, respectively compared to NYC overall, which averages 79% of pre covid ridership. On the other hand, areas that have fewer financial service companies and more industries that cater to people’s lives outside of work like nightlife and entertainment have flourished. Subway ridership in Greenpoint and Williamsburg has surpassed 2019 ridership levels by 18%. The Office of the Comptroller of NY also put out a list of the subway stations that have seen the biggest and smallest changes in ridership since Covid-19. This list presents compelling demographic data on what neighborhoods may be the ones to stay away from. It can be found here.
Looking at the changes within job industries is another good way to measure how the city has bounced back from Covid. Three industries stand out.
Construction sector
The construction industry is poised to exceed 2019 levels of activity this year, per the NYS Comptroller’s office. This is surprising because many thought that after the expiration of the 421 a tax abatement in NYC in 2022, where much of the construction occurs in NY state, that permitting would decline heavily. Those folks were not entirely incorrect; new building permit issuances have declined by 29.4%. That said, the issuance of permits for moderate alterations (alteration 2s) has increased by 5% from the prior year. This shows a remarkable recovery in the housing.
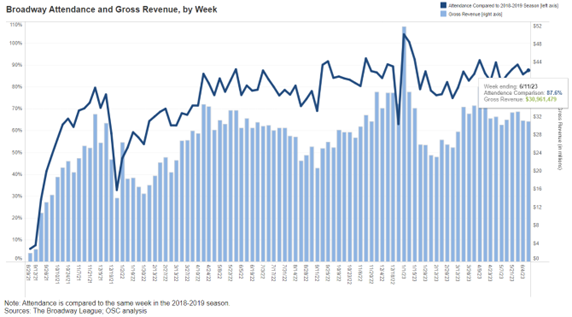
Entertainment / theater sector
Total revenues for the 2022-2023 season were $1.6Bn, or 13.8% less than the 2018-2019 season. This is a narrower gap than the difference in subway ridership. More former theater viewers have returned to their theater seats, than former subway riders have returned to the underground tracks to commute.
Restaurant sector
Within the restaurant sector, there were nearly the same number of jobs in May 2023 as there were in May 2023: roughly 324,000. Most restaurant workers who commute to work will use public transports. It stands to reason then, that many of these workers are working in areas like Williamsburg that have demonstrated greater subway ridership.
There are different ways of evaluating the recovery of NYC after Covid, and I hope these hand-picked insights help offer some guidance as to where things are headed.
Sources: NYS Comptroller’s Office, WSJ, CPI Report


