

Reading the National Market, Interpreting New York

As I alluded to last week, looking at the investment property market in NYC without understanding the bigger picture can lead investors to miss the forest for the trees and underestimate the importance of macroeconomic patterns. The pendulum swings both ways; as much as a rising tide lifts all boats, higher interest rates drag on all deals. Let’s look at some data on the U.S. multifamily market to better understand the NYC market.
National Supply Peaks and a Reset in Development
According to CBRE’s December 2024 projections for 2025 multifamily growth, the worst of the recent supply-demand mismatch, especially in sunbelt markets, is nearing its end. All 16 markets (see chart below) with the most aggressive development pipelines are expected to have reached their peaks this year.
That tapering supply is already reshaping the landscape. CBRE projects that multifamily construction starts this year will fall 74% below their 2021 peak. A pullback of that magnitude will likely create real tailwinds for rent growth in the years to come, especially as absorption normalizes and backlogs clear.

Rent vs. Buy: A Durable Driver of Demand
While supply dynamics tell one part of the story, demand drivers provide equally important context. One of the more durable tailwinds for the rental market today is the widening gap between the cost of renting and the cost of owning a home. According to CBRE, the average American household now saves roughly 35% in monthly housing expenses by renting rather than buying—the largest spread recorded between 2002 and 2022. In West Coast cities like Los Angeles, Orange County, and the San Francisco Bay Area, that monthly ownership premium can range from 2x to 2.5x the cost of renting an apartment.
This dynamic strengthens the position of landlords, especially in markets where buying is simply not viable for most households (high price to wage ratios). In those environments, tenants are more likely to accept rent increases and remain in place, extending tenancy and supporting stable occupancy.
From an investor’s perspective, this differential bears some resemblance to the Gross Rent Multiple (GRM). Gross rent multiple represents the price of the property divided by its gross rent. Traditionally used to evaluate the price-to-income ratio on a specific property, GRM serves as a shorthand for how expensive a purchase is, or how discounted it is compared to the market. The rent vs. buy spread can serve a similar function by serving as indicators to investors of where they can price their rental units. The wider the gap between monthly homeowning costs and rental rates, the more room there may be for rents to grow before renters start considering their options. Naturally, there may be a point where rents grow too much, and nearby towns and states begin to absorb the demand.

Viewed through the lens of investment performance, this delta can act as a buffer against rent sensitivity. Where the cost of homeownership far outpaces rent, tenants are more likely to stay longer and absorb higher rents. These dynamics can support stronger rent growth over time, even in high-cost cities. But, as we have seen in Austin, TX, oversupply of inventory softens all rents, so this indicator is not a perfect guide for where rent growth is taking place.
What’s more, the data complicates any simple takeaway. Some relatively affordable cities, like Phoenix and Nashville, also show wide rent vs. buy spreads, while traditionally high-cost markets like NYC and Miami slightly smaller differentials. So rather than predicting where rents are highest, the rent vs. buy spread may be more useful as a signal of how vulnerable the rents are to decline. Interpreting the data this way means Los Angeles and Austin would see sustained rent growth but a market like Miami, despite its high cost of living, could have limits as a market as far as how high the rent can go.

Against this national backdrop, how does New York City’s multifamily market compare?
NYC in Context: New Supply Absorption and Vacancy Levels
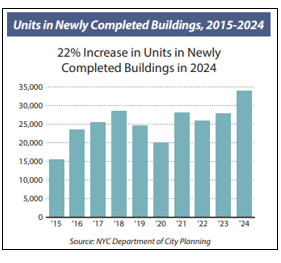
Despite national volatility, New York City remains one of the strongest-performing rental markets in the country. In 2024, developers delivered 33,974 new apartment units—more than in any other year since 1965, according to NYC’s Rent Guidelines Board. Yet even this record-setting pace did little to disrupt the underlying supply-demand imbalance in NYC. In fact, the number of new units delivered represents less than 1% of the total housing supply in NYC, pegged at ~3.7 million housing units with a 1.4 million condos, co-ops, and SFRs and 2.3 million rental apartments.
What’s more, CBRE’s Q1 2025 report notes that NYC had the highest number of apartments absorbed of any U.S. metro, meaning more apartments were leased here than anywhere else. But as a share of the total rental inventory, absorption remained modest—among the lowest nationally, behind only Los Angeles. This reflects how tight NYC’s baseline supply remains. New apartment deliveries were leased, but they barely moved the needle relative to the size of the overall market, highlighting the enduring value of investment in a perennially supply constrained market.
Contrast NYC with Austin, TX, where roughly 7,000 units were absorbed in 20224, or about 62% more than the number of apartments delivered, and those leases accounted for nearly 9% of the entire rental stock. In Austin, that level of absorption suggests outsized demand and a much smaller housing base. It also helps explain why markets like Austin are poised to snap back faster once excess supply burns off – and it further highlights the cyclicality of places with smaller supply bases where the marginal addition/subtraction of construction can change investing environments quickly.


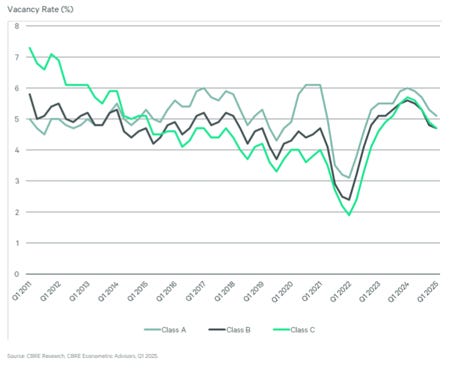
Absorption patterns directly impact vacancy rates, where New York City’s unique position becomes even more apparent. NYC's low vacancy rates reinforce the difference between the big apple and the rest of the country. Nationally, multifamily vacancy stands at around 4%, while in New York City it’s just 1.41%, based on 2023 data. This supply pressure has continued to underpin rent growth, even as affordability challenges rise.

NYC Rent Growth and the FARE Act’s Role
StreetEasy estimated that NYC’s year-over-year rent growth in June 2025 was 5.2%, or about six times the national rent growth of 0.9%. It’s important to caveat that asking rents don’t always align with signed leases, they’re a useful indicator of landlord pricing power and market direction. Much of NYC’s rent growth this summer was and will be owed to the Fairness in Apartment Rental Expenses (FARE) Act, implemented on June 11th, changed the way rental costs and fees are disclosed and allocated. The policy aimed to create more transparency for tenants and lower the upfront costs to move into apartments, but in practice, it has triggered a significant repricing in listed rents.


According to StreetEasy, NYC rent growth in June 2025 was estimated around 5.2% - estimated because the data comes from median asking rents, not signed leases – or just under 6 times the U.S.’s estimate of rent growth of 0.9%. StreetEasy data shows that from June 1 to June 10, the median asking rent in NYC was $4,750. By June 11 to June 23, that number had climbed to $5,495, representing a 16% increase in less than two weeks. Compared to the same period last year, post-FARE rents are up nearly 20%.
These shifts were echoed in anecdotal landlord behavior from my survey on June 16th:
46% of landlords raised rents by more than 10%
A quarter raised rents more modestly (under 5%)
Roughly a quarter chose to self-lease
Fewer than 5% hired professional leasing agents

Investor Sentiment and the NYC Opportunity Set
These rent growth dynamics are reshaping how investors consider opportunities nationally and in NYC. National sentiment among multifamily investors has begun to shift with a slight bias toward core assets. According to CBRE’s Q1 2025 Buyer & Seller Sentiment Survey, many buyers are showing increased interest in core assets, particularly those with minimal deferred maintenance and stable income profiles. In contrast, sellers of these same assets remain more reserved or neutral, likely waiting for further pricing clarity or relief on financing costs.

In New York, a similar divergence is taking shape. Several middle market investors report renewed interest in cash flow stabilized assets that offer near-term yield at spreads within 75–100 basis points of GSE debt pricing. These buyers come from diversified backgrounds and some are developers who are accustomed to long lead times and higher execution risk. In the context of the supply-constrained NYC market, core properties with established cash flow and minimal renovation risks represent a fast path to yield.
At the heart of this dynamic is underwriting. Investors are revisiting their assumptions about rent growth durability, exit cap rates, and operational risk. And despite NYC’s regulatory headwinds, many underwrite stronger rent growth in value-add multifamily deals here than in any other U.S. market.
Another reason NYC remains attractive—despite tight rent laws and high entry costs—is the perception of cap rate stability on exit. CBRE data shows that buyers remain willing to underwrite aggressive exit cap rates in a handful of cities where fundamentals support it.
New York and Seattle lead in this category, with investors pricing in both high rent growth and exit cap rates that match, or only slightly exceed in-place cap rates at acquisition (4.5%/4.5% in NYC and 4.5%/4.75% in Seattle). In Chicago, investors are also modeling in 4%+ rent growth, despite public finance challenges and elevated vacancy in some submarkets. But few metros match the combination of demand, scarcity, and pricing support that New York offers today. For many investors, NYC no longer looks like a high-risk, high-regulation outlier—it looks like a market with constrained downside and optionality on the upside, particularly if interest rates stabilize and modest rent growth continues. This investor confidence is reflected in capital deployment patterns across major markets.

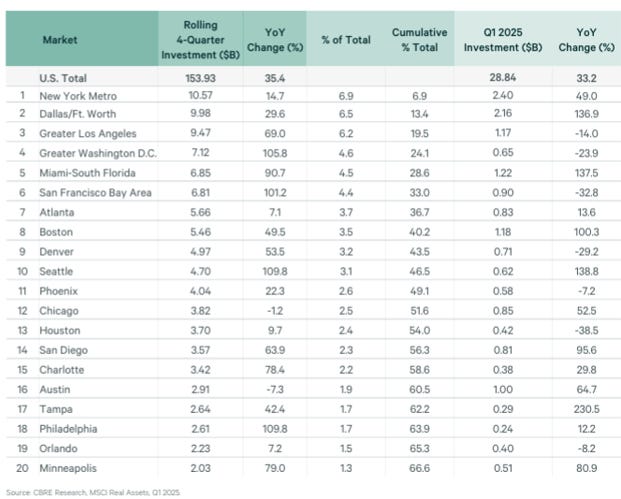
According to CBRE’s Q1 2025 Multifamily Figures Report, the six most active U.S. metros accounted for nearly 30% of total multifamily transaction volume in the first quarter, totaling roughly $50 billion. Among them, New York City, Dallas–Fort Worth, and Miami saw year-over-year growth in investment dollars. In contrast, markets like Los Angeles, Washington D.C., and the Bay Area posted significant declines, with investment volume falling between 15% and 30% compared to last year. Notably, Dallas investors closed nearly as much in volume as their NYC counterparts—highlighting the enduring appeal of high-growth, low-regulation markets even as capital becomes more selective.
But New York’s resilience is particularly telling. Even with headwinds like rent stabilization and political risk, the city continues to attract capital because its fundamentals are difficult to replicate elsewhere: strong household formation, supply constraints, consistent demand, and, as seen earlier, widening pricing power in select product types (read: new construction and Free market apts.).
The NYC Pitch
Across markets, the picture is beginning to become clear. National supply pipelines are cresting, and construction starts have slowed considerably, reducing the likelihood of prolonged oversupply. At the same time, the cost gap between renting and owning has widened meaningfully in many cities, reinforcing the role of multifamily housing as the default option for a growing share of households. But as the rent-versus-buy analysis shows, the implications vary by market and what holds in Los Angeles or Phoenix does not necessarily translate to New York.
In New York City, the interaction between policy and pricing remains a defining feature. The FARE Act’s impact on rent growth is an acute example of how markets respond to policy. Seeing rent increases equivalent to 1 month’s rent to offset broker fees will become more commonplace as landlords adapt to the new law. And, in a supply constrained market like NYC, rent growth is sticky.
Investor sentiment reflects this balance. There is growing interest in stable, cash-flowing properties, especially where rent growth appears durable and cap rates are expected to hold. Still, underwriting is more disciplined, and investor focus is narrower than in previous cycles. The ability to underwrite moderate rent growth without depending on major repositioning or outsized leverage is driving much of the renewed interest in New York. Things like the FARE act pushing rents up are just added benefits over time.
Looking ahead, NYC's fundamentals point to continued outperformance. Several key factors support this. NYC maintains sub-1.5% vacancy rates, the widening rent-versus-buy gap reinforces rental demand, and policy changes like the FARE Act demonstrate rent growth resilience even amid regulatory headwinds. The risks of oversupply that plague less mature markets remain minimal here, as the supply-demand imbalance shows no sign of reversing. Where pricing is rational and fundamentals align, the case for New York remains compelling. For investors seeking stable cash flows with high rent growth potential, NYC offers a rare combination of downside protection and upside optionality.
I am bullish on NYC multifamily.

If you want to understand the NYC real estate market better from practitioners with boots on the ground, please reach out to us at rs@sinclairrealtyco.com, or call at 646 326 2220.
Or, if you’re curious about what your assets are worth in this dynamic and changing environment, reach out to us.
Best Regards,
Romain Sinclair
646 326 2220
Sources:
CBRE. (2025, Q1). U.S. multifamily figures report. https://mktgdocs.cbre.com/2299/8b1f4369-f46c-40cd-9ace-ff957352af43-425097188/Q1_2025_U.S._Multifamily_Figur.pdf
New York City Rent Guidelines Board. (2025, May). 2025 housing supply report. https://rentguidelinesboard.cityofnewyork.us/wp-content/uploads/2025/05/2025-HSR.pdf
CBRE. (2025, April 10). Multifamily buyer and seller sentiment improves in Q1. https://www.cbre.com/insights/briefs/multifamily-buyer-and-seller-sentiment-improves-in-q1
CBRE. (2024, December). U.S. real estate market outlook 2025: Multifamily. https://www.cbre.com/insights/books/us-real-estate-market-outlook-2025/multifamily
StreetEasy. (2025, June 27). NYC rental market remains stable since FARE Act, despite rent hikes. https://streeteasy.com/blog/nyc-rental-market-stable-since-fare-act/