Retail’s Flight To Quality & More Market Maps
NYC’s retail property investment market is splitting in two, and most investors are missing it. While headlines celebrate retail's "comeback" with 14% vacancy rates on prime corridors, the reality is more nuanced: credit tenants in luxury locations are commanding premium pricing, while many other retail locations languish. Our buyer positioning data from $1m-$20m Brooklyn deals reveals how smart money is responding to this bifurcation. Buyer selectivity aligns with some of the risks and the opportunities in the sector, as I alluded to in my prior piece. With the Fed holding rates steady amid sticky inflation and last week's jobs report showing downward revisions, institutional capital is choosing quality.
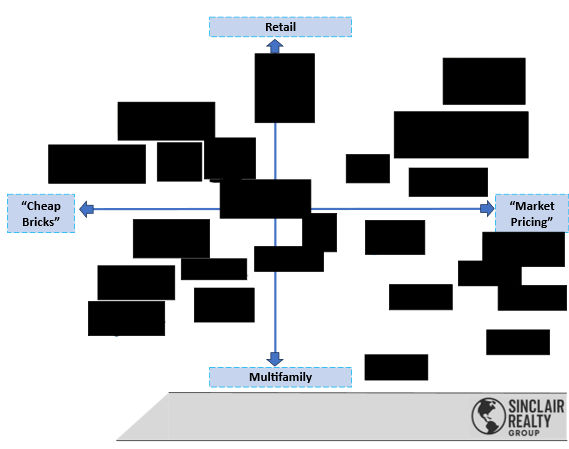
Our buyer positioning map illustrates this split well. The chart below segments active buyers according to their affinity for retail property investing versus multifamily, as well as their willingness to pay market pricing for assets.
Buyers in Brooklyn ($1m-$20m Deals)
Retail / Multifamily & Value Hunters / Premium Buyers

In the above chart, the x-axis represents willingness to pay market price and the y-axis represents the gradient between investors comfortable with retail property investment and those focused on pure play multifamily. The bottom-right quadrant shows institutional players willing to pay premium pricing for pure multifamily plays, while the top-left reveals value hunters targeting retail-heavy properties at discounts.
The "retail recovery" narrative masks a fundamental market split. Yes, prime corridors show 14% vacancy, the lowest since 2017, as Meridian's James Famularo notes on Linkedin. Madison Avenue, Soho, and Times Square are seeing both rent growth and tenant competition, with Class A spaces commanding premiums with little-to-no concessions. On the other hand, under-renovated spaces are experiencing 20%+ vacancy with aggressive concessions still required. As Famularo himself acknowledges, many properties are "still offering aggressive concessions," in certain submarkets.

This isn't a broad retail recovery, it's a flight to quality that mirrors what's happening in office markets, where ultra-luxury Class A properties have tenant waiting lists and pre-leasing, while B and C class buildings struggle forward. This bifurcation plays out in actual transactions. A trio of Williamsburg ground-up retail developments (95, 97, 107 North 6th) sold for $60M to Acadia Realty Trust at mid-4% cap rates, at a price per square foot of over $4,000/SF. These buyers occupy our map's top-right quadrant: institutional capital chasing stabilized, credit assets regardless of price. Similarly, Prada's $425M building purchase and Gucci's parent company acquiring its building on 717 Fifth Avenue for $963M represent the same phenomenon: premium capital paying premium prices for trophy assets with credit tenants.
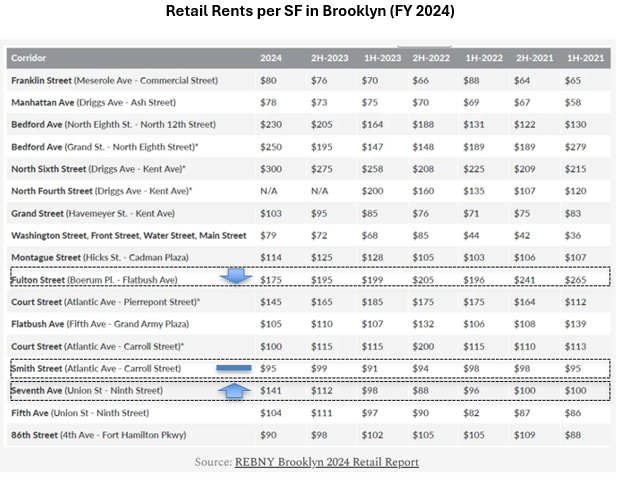
Meanwhile, in the top-left quadrant low-basis buyers are circling lower end- retail properties in NYC. Places like Manhattan Valley or Brooklyn Heights, where barbershops and pizzerias cannot sustain the rents (or see the rent growth) that experiential SoHo concepts command. In these corridors, which also comprise Sunset Park’s 5th avenue, Harlem’s 125th Street, Bedford Stuyvesant’s Fulton Street and many others, retailers face extended vacancies and flat rents despite higher operating expenses.
The market map of buyers communicates this reality clearly, showing a split between buyers looking for retail bargains and those willing to spend premium dollars. The top-left represents value hunters seeking deep discounts on tired, lackluster assets. The top-right represents REITs and larger groups focused on capital preservation, showcasing willingness to pay higher prices per foot for better tenants. Often, these big spenders are purchasing fully renovated, newly delivered properties, and they're buying these for no less than approximately $20M.
Sellers hoping for across-the-board retail tailwinds should take a closer look at the broader economic signals. Sellers expecting broad retail tailwinds should note that unstable trade environments and global uncertainty hinder price expansion across all asset classes, but especially retail. Investors are increasingly selective, funneling capital into a narrow set of properties that have prime locations, credit tenancies, and recent renovations. That's where cap rates are tightening.
The resurgence of luxury retail, what Famularo references when discussing Bleecker Street's recovery, is not synonymous with broad market recovery. It's a selective rally, not a rising tide lifting all boats. Everywhere else, buyers are cautious, careful, and often waiting and watching.
Discernment
Discernment
Discernment
For sellers of retail properties, this means being honest with yourself, partners, and purchasers. If your retail properties aren’t in primary corridors, they shouldn’t be priced like they are. If leases are close to expiry and the properties are not on Fifth avenue or primary retail corridors, don’t send a message to the market that trying to recast lease-up risk and vacancy concerns as a value-add an opportunity for upside. But perhaps the property sits on a signaled corner, is on a wide street, or has a drive-through. These are all great value levers to look for with more “tired” retail properties, or off- main street properties. Be honest and clear about your properties’ strengths, always.
For more insights like these, please get in touch with us at Sinclair Realty Group. Call 646 817 4784, or e-mail us at rs@sinclairrealtyco.com.
I am bullish on NYC multifamily
Best Regards,
Romain Sinclair
646 326 2220
Methodology Note: This market map showcases different buyer types in NYC's sub-$20m commercial real estate market based on my direct broker experience. I have removed buyers without public websites or consistent LLC names for privacy.


