The Tale of Three Boroughs: How NYC's Rent Laws Shape NOI Growth

New York City real estate is not just one market. Instead, it is composed of many smaller markets. Nowhere is that more evident than in the divergent trajectories of Core Manhattan, the Bronx, and Brooklyn. The City's Rent Guidelines Board (RGB) publishes annual income and expense studies highlighting the disparities in the performance of properties (largely) according to which borough they are in. Over the last few years, the general trendline shows building expenses growing rapidly and owners scrambling to keep their rents from being overtaken. In addition to stressing this previous point, the RGB studies provide data to remind us how much location can drive whether a property will do well or poorly.
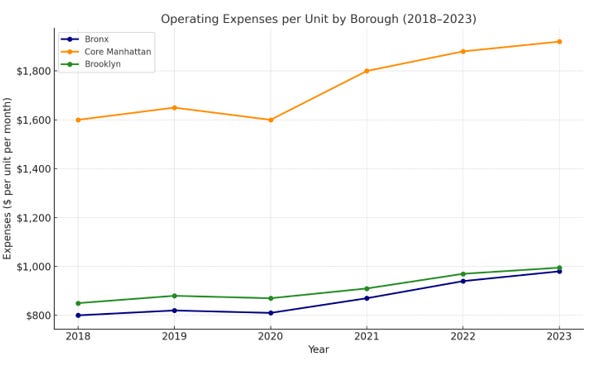
Between 2018 and 2023, building operating expenses marched steadily upward in all five boroughs of NYC. Property taxes remained the single largest cost line item, constituting 28-32% of operating expenses. In Core Manhattan, defined as Manhattan south of West 110th Street and East 96th Street, average per-unit expenditures reached $1,916 monthly in 2023, up from $1,606 in 2018. In the Bronx, expenses per unit rose from $801 to $969 per unit over that same time, while Brooklyn expenses increased more modestly from $858 to $1,001.
Yet the critical detail lies not just in costs but in the gap—or lack thereof—between income and expenses. Some areas in NYC have grown post-pandemic because of landlords' ability to produce well-finished properties with compelling ground-floor retail, amenities, and the like. Trendy new construction or gut rehabs on 100-year-old buildings. But this ultimately rests on landlords' ability to profit by doing so. Rent growth and expense trends drive where investors place their capital within NYC.
Core Manhattan: A Safe Haven for Multifamily
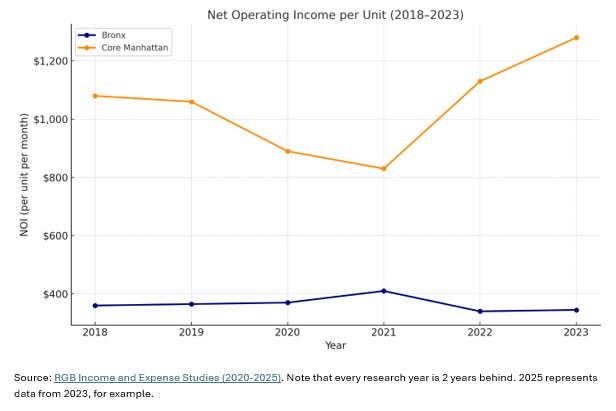
Core Manhattan’s numbers are enviable. In 2023 (the latest year for which data is available), average income per unit hit $3,252/month—up from $2,773 in 2018, indicating a 14% increase. Net operating income (NOI) soared 19.2% over those five years. The story behind that resilience? 84% of rent-stabilized buildings in Core Manhattan also include free-market units. This matters. It means landlords can capture meaningful rent increases on a portion of their portfolio, providing a buffer against the flat-to-low growth of rent-stabilized income. It also means their NOI rises not just through cost control—but through actual revenue growth. That's a luxury most Bronx landlords simply don't have.
The Bronx: Trapped by Regulation
In the Bronx, the story is bleaker. Average income per unit rose from $1,160 to just $1,277 over six years—less than $20/month annually. Expenses, meanwhile, grew $168 per unit over the same period. NOI in the Bronx is declining. RGB data shows that NOI decreased from $362 in 2018 to $339 in 2023, highlighting a 6% decline in NOI. Negative NOI growth is bad business and in housing that means disinvestment. But why is the Bronx so challenged?
Unlike Manhattan, the Bronx’s rental stock is overwhelmingly regulated. In 75% of rent-stabilized buildings in the Bronx, all units are rent-stabilized. That means no escape valve, rent spikes, or upside from renovation or repositioning - just a slow squeeze. Some submarkets are even worse off. Soundview/Parkchester saw NOI drop 10.6% in a year, and the Bronx was the only borough with three neighborhoods that all saw NOI declines. When considering this data, it is no surprise that lenders are nervous. As I recently discussed here, these concerns are prompting agencies and groups like the SEC to scrutinize banks with high rent-stabilized loan exposure—many concentrated in these boroughs.
Sidenote:
The average Core Manhattan multifamily has 281% more NOI per unit than the equivalent Bronx property. Does the Core Manhattan property trade at close to 4 times the Bronx property value? (The -1% YOY declining NOI on Bronx properties might dampen valuations, but that’s still a large spread.) But what if some Manhattan properties are offered at only three times the PPU of Bronx properties? Or what if a broker in the Bronx offers investors properties trading more than 75% cheaper than Manhattan? Where there are opportunities for investors to arbitrage value, they must take them. If the market underprices buildings in the Bronx based on the NOI they produce and will produce in the future, an opportunity exists to buy.
Brooklyn: A Borough at a Crossroads
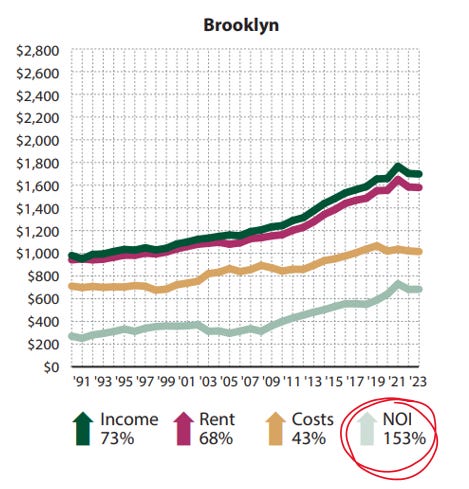
Then there’s Brooklyn—once the scrappy cousin, now a contender. From 2018 to 2023, Brooklyn’s average NOI (across the free market and rent-stabilized properties) catapulted from $467 to $683 per unit, representing a 46% increase. Rents ticked upward even during COVID-19, and expense growth was more restrained than in Manhattan or the Bronx. It turns out that when rents increase faster than in other boroughs and expenses grow slower than in other boroughs, it adds a lot of value. Brooklyn has been a story of great economic growth, and rent growth in the region reflects this.
But Brooklyn's future is uncertain. It looks like Manhattan did a decade ago with hip neighborhoods, strong private equity interest, condo conversions abound, and a broader rent surge. However, scratch beneath the surface and the Bronx peeks through. In 61% of rent-stabilized buildings, every single unit is still rent-regulated. This presents a real challenge to rent and NOI growth.
In some ways, Brooklyn is split. Some submarkets like Williamsburg and Downtown Brooklyn mirror Manhattan. Others like East Flatbush or Brownsville mirror the Bronx in terms of their growth prospects and rent stabilization concentration. Whether the borough continues its meteoric rise or hits a regulatory ceiling may depend entirely on the future of rent laws.
A Future of Diverging Outcomes
These trends are not just academic; they’re existential for investors.
If you bought a building in Core Manhattan with a mix of stabilized and free-market units, you likely weathered the 2019 rent reforms gracefully.
If you're holding on in the Bronx, your building is probably worth less today than five years ago—even if rents technically rose.
And if you’re eyeing Brooklyn, your fate might rest on which side of the rent-stabilization divide your building sits.
So, what does this mean for the future?
Investors Must Now Think Like Regulators
The data presents a challenge but also a roadmap. If you believe the state will eventually recognize the unsustainability of blanket rent controls and offer some pathway to revenue growth—Brooklyn will offer significant upside. However, if policy remains unchanged, you may lock yourself into break-even yields when buying fully stabilized buildings. In this context, small details like unit mixes, local tax codes (1, 2a, 2b), and neighboring property owners' behavior really matter. Portfolio-level thinking is also essential. A building that breaks even on NOI may still have strategic value if paired with another that offers cash flow.
The real takeaway from six years of RGB data is that rent regulations don't evenly impact every building in every borough. Geography matters a great deal for building values, and so does policy. Diversification, both in building type and regulatory exposure, matters a great deal as well. Yes, NYC remains a market of unmatched resilience. Yes, there are pockets of growth even within rent-regulated housing. But for serious investors, the path forward requires real discernment. Analyze the data, respect the asymmetries, and know your borough.
I am bullish on NYC multifamily.
Best Regards
Romain Sinclair
646 326 2220